Search history
Clear

- Topics
X-Sign User Manual
In this section, we'll explain how to manage content in X-Sign, control the player, and set up playlists.
X-sign 2.0 / X-sign User manual / Interactive (Premium)
Viewing an Interactive Report
2020 / 08 / 25
Once you have enabled interactive statistics for an interactive project, you can view the data for your statistics in X-Sign Manager. The following is an introduction to viewing and reviewing interactive reports.
To review the interactive statistics for an interactive project:
1. Log in to your X-Sign Manager account. Go to Report Analysis > Touch Usage Report (Beta).
2. In the Touch Usage Report (Beta) page you can review statistics using the following items.
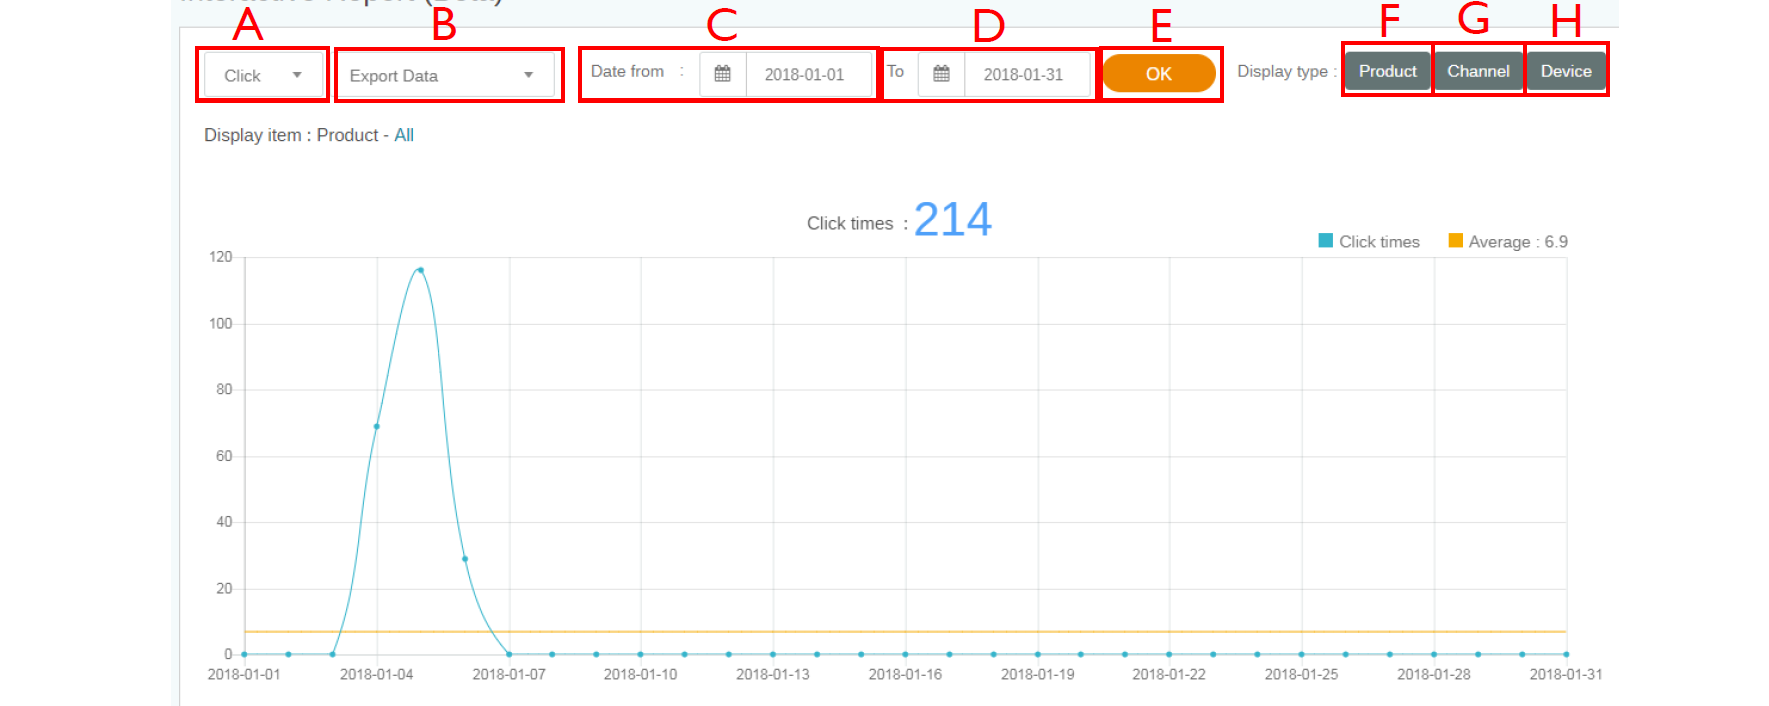
A. Type of Report – Click the icon to choose one of the following data sets to display: Click, Product, Channel, Category, or Device.
B. Export Data – Click the icon to choose an export setting from the dropdown list. You can select All Data (CSV) to export all interactive data to a csv-file format, or you can select Data in this page (PDF) to export the data displayed on the page to a PDF.
C. Date Form – Choose the start date for the data you want to display in your report.
D. To – Choose the end date for the data you want to display in your report.
E. OK – Select OK to confirm the selections and generate the report in the window below.
F. Product – Select Product to choose the data for specific products (i.e. - categories) you would like to display in your report.
G. Channel – Select Channel to choose the data for specific channel(s) you would like to display in your report.
H. Device – Select Device to choose the data for specific device(s) you would like to display in your report.
TOP